Friction Testing: PV Approach
Wear testing between materials is a critical methodology in mechanical engineering, as it helps determine the durability and operational limits of components that undergo friction. The ability to accurately predict how a material wears under different conditions ensures reliability and safety, reduces maintenance costs, and guides the selection of materials for demanding applications. One of the most effective ways to accelerate wear tests and assess material performance is by utilizing the Pressure-Velocity (PV) factor, which combines the effects of contact pressure and the relative sliding velocity between surfaces.
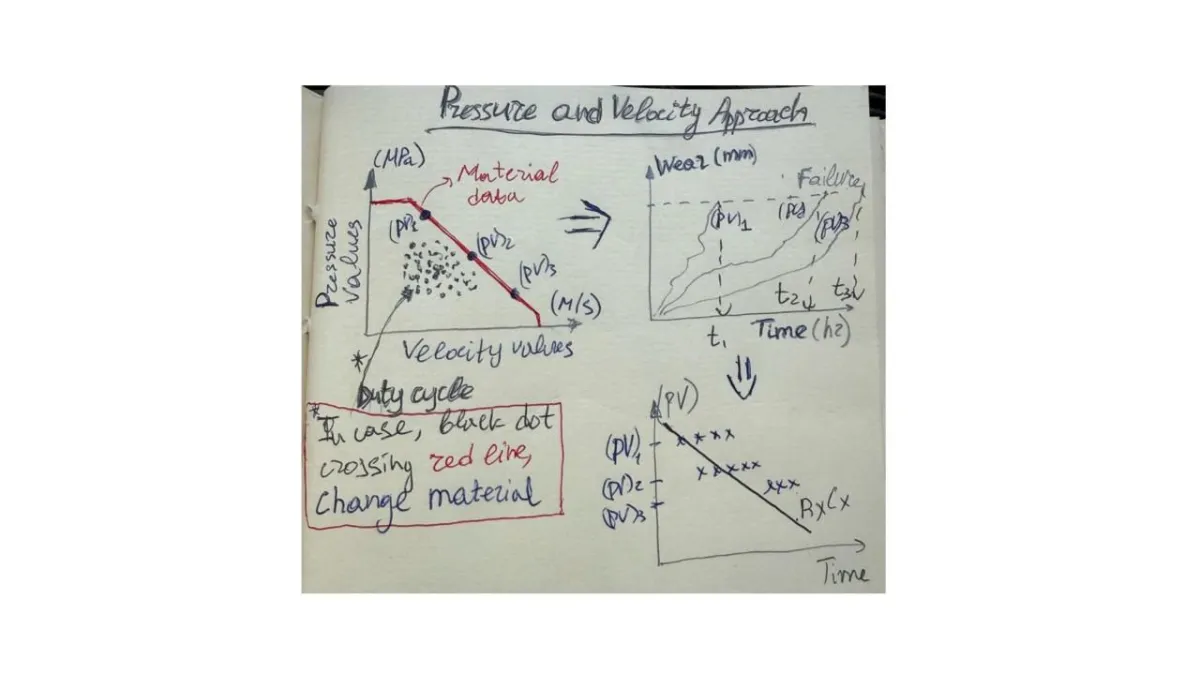
The concept of PV originates from tribological studies, where both pressure (P) and velocity (V) significantly influence the frictional heat and subsequent wear rate at the interface of two materials. PV is simply calculated as the product of pressure (usually in psi or N/mm²) and sliding velocity (ft/min or m/s). This value is a key indicator of the severity of the tribological environment. Materials are typically rated with a maximum PV value; exceeding this threshold can accelerate wear and result in premature failure of the component. For instance, PTFE-based composites and bronze-graphite alloys might have PV ratings ranging from 20,000 up to 100,000 or higher, depending on their formulation, lubrication, and geometry.

Accelerated wear testing involves increasing either the pressure, the velocity, or both, to push the PV value closer to the material's limit, simulating long-term wear in a shorter time frame. The duty cycle—the ratio and pattern of loading and movement that reflect real-life application scenarios—should be modeled to add realism and reliability to the test data. In practice, engineers extract operational conditions (peak load, speed profile) from the actual duty cycle and calculate representative P and V values to generate test points on the PV map. For example, a sleeve bearing operating at 500psi and 100ft/min would have a PV of 50,000, and these dots should be plotted on the PV vs. wear rate diagram.
It is essential that all PV dots determined from the duty cycle remain within the boundary defined by the material's rated PV line. This ensures the accelerated test simulates conditions the component will experience in service without exceeding the material’s wear capacity, potentially introducing unrepresentative failure modes. Each material has distinct limits for both pressure and velocity, so merely matching PV values from varying combinations (high P/low V or low P/high V) is not always equivalent; detailed boundaries should be referenced in the material datasheets.
By properly analyzing the PV map and referencing the duty cycle, designers and reliability specialists can select materials and design wear tests that will generate relevant data quickly, while ensuring the accelerated test does not stray into regimes where failure is unrepresentative of typical service life. This approach gives a robust picture of wear performance, supports efficient R&D validation, and enables predictive maintenance planning for high-reliability systems.
